
Whether you are looking to get your energy back, to help your team understand, engage your team in your business or start reaching your goals, Three Page® has ONE ANSWER:
The Corporate Dashboard.
This simple and easy to use software is the key to every success story that you have read about. It allows you to manage your business by the numbers by simply managing the numbers!
It’s as easy as 1 – 2 – 3!
1. Input
Input your previous year’s numbers
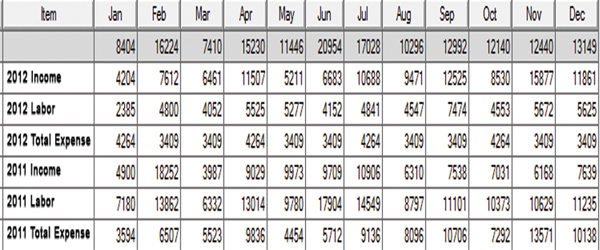
Existing Monthly Values ** 2 Years of numbers are recommended** – Click to enhance image
This step in only done once when you set up your dashboard. You simply put in your actual numbers from the last 2 years (if available) for each item being tracked.
Input your goals for this fiscal year!
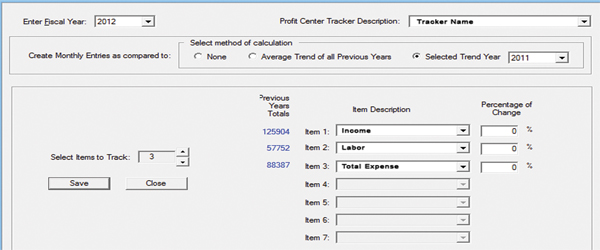
Forecast Entry – Click to enhance image
This step is done once at the start of your fiscal year.
2. Update
Update your dashboard by putting in your numbers every week.
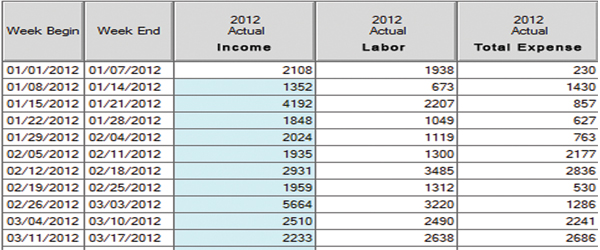
Dashboard Input – click to enhance image
Update yours dashboard once a week in a matter of minutes! Then you can print reports to help you communicate it to your team!
3. Communicate
Three Page® Dashboard provides 3 separate reports that you can use to communicate your progress to your team on a weekly basis. All of them in formats that they every one of them can understand.
The Weekly Tracker
Weekly Tracker – Click to enhance image
This report is simple scoreboard that will let your team know where they are compared to goals that they set. The scoreboard shows you the forecast numbers, the actual numbers and the variance between the two on a WEEKLY, MONTHLY, QUARTERLY and YEARLY basis!
This is PERFECT for your weekly meetings. It also has an optional meeting agenda.
The Graph
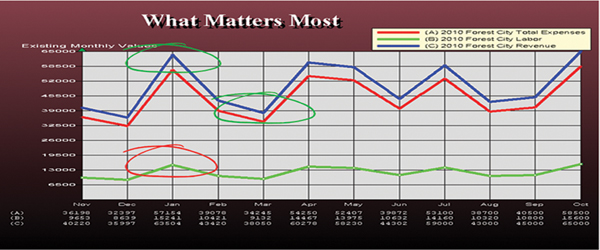
Line Graph – Click to enhance image
Everyone is familiar with graphs. They are perfect for those team members who are who are not the “number kind of people”. There are line, bar and pie graphs are available.
These graphs are a simple and easy way identify trends in the rise and fall of sales or production in your company.
The Operating Schedule
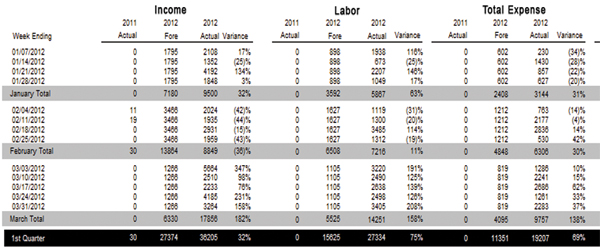
Ops_Schedule – Click to enhance image
This report is perfect for the “number people” on your team. It provides a complete week by week overview of your company all in one compact report. It is an essential tool for identifying trends in your business.
Can you imagine?
Having this much control over your company in a matter of minutes??
Guess What…YOU CAN!
Contact us NOW to get your Corporate Dashboard TODAY!
Download Brochure Contact Us